Daily Fantasy Playbook 2015: Defense/Special Teams Strategy

Every position matters in fantasy football. The amount of points your defense/special teams scores could be the difference between winning the Milli-Maker or sitting alone listening to Lil’ Wayne’s A Milli, lamenting over what could have been. Sounds easy, but how do you go about making the best defense/special teams selections?
Editor's Note: If you open a new account on FanDuel with a minimum $10 deposit, you’ll receive a free one-year subscription to 4for4! Details here.
Interceptions & Sacks
When selecting a defense/special teams, you are essentially trying to maximize sacks, turnovers and return touchdowns. Table 1 below shows the correlation coefficients1 between various relevant statistics and defense/special teams fantasy points per game.
| Correlation to Fantasy Points/Game | |
|---|---|
| Defensive TD/Game | 0.74 |
| Interceptions/Game | 0.60 |
| Fumble Recoveries/Game | 0.57 |
| Sacks/Game | 0.51 |
| Kick Return TD/Game | 0.45 |
| Points Allowed/Game | -0.41 |
| QB Rating Allowed | -0.39 |
| Opponent Drive Start | -0.34 |
| Rushing TD/Game Allowed | -0.31 |
| Yards/ Play Allowed | -0.29 |
| Safety/Game | 0.27 |
| Passing Yards/Attempt Allowed | -0.26 |
| Rushing Yards Allowed/Game | -0.22 |
| Rushing Yards/Attempt Allowed | -0.19 |
| Total Yards/Game Allowed | -0.15 |
| Passing TD/Game Allowed | -0.13 |
| Passing Yards Allowed/Game | -0.03 |
Defensive and special teams touchdowns are very valuable because they’re worth a lot more points than any other type of fantasy scoring play for a D/ST. Those touchdowns are rare, however. Only 169 have occurred over the last two seasons combined, which works out to an average of 0.17 per game for each team.
Since touchdowns are difficult to predict, the best way to maximize your chances are to try and maximize exposure to the plays on which a defensive touchdown can occur, namely sacks and interceptions.
When projecting how likely an opposing quarterback is to throw interceptions, avoid making the mistake of overweighing a quarterback’s previous interception rate. While it may seem counterintuitive, the fact is interception rate has almost no year-to-year predictability.
In 2014, I looked at the correlation between interception rate in year y and interception rate in year y + 1 for all quarterbacks who played at least 25 percent of their team’s snaps in consecutive seasons over a five year stretch between 2009-13. It turns out the correlation is an extremely low 0.06 between interception rate in year y and year y + 1, meaning past interception rate has nearly no predictive power in terms of forecasting future interception rate.
The statistic most likely to predict interceptions is completion percentage, according to a recent study2. To make sure this is actionable information, I used my aforementioned quarterback sample to calculate the correlation between completion percentages in year y and year y + 1.
It turns out completion percentages from one year to the next have a correlation coefficient of 0.65, indicating a strong relationship. Past completion percentage can be used to predict future completion percentage, and the quarterbacks projected to be the most inaccurate should be your D/ST targets.
The NFL average completion rate is 61.6 percent over the last two seasons. Table 2 below shows some quarterbacks to target for interceptions in 2015, based on their cumulative completion percentage over the past three seasons.
| Quarterback | 2012-14 Completion % | 2012-14 Pass Attempts |
|---|---|---|
| Brian Hoyer | 56.0 | 588 |
| Geno Smith | 57.5 | 810 |
| Derek Carr | 58.1 | 599 |
| EJ Manuel | 58.6 | 437 |
| Blake Bortles | 58.8 | 476 |
| Matt Cassel | 59.0 | 602 |
The two first-round rookie quarterback starters – Jameis Winston and Marcus Mariota – may also be prime defense/special teams targets. Over the past ten seasons, first-round rookie quarterbacks have attempted 8,424 passes and completed just 57.1 percent of them.
I also studied quarterback sack rates (sacks divided by pass attempts) over the same five season stretch mentioned above and found that 44 percent of a quarterback’s sack rate in year y + 1 is explained by his sack rate in the previous year (year y), meaning quarterback sack rates – unlike interception rates – can be used predictively. Although the offensive line and opposing pass rush factors in, some quarterbacks are simply better than others at getting rid of the ball quickly.
In addition to targeting inaccurate quarterbacks, target those who are prone to taking sacks. While sacks don’t have the same touchdown upside of interceptions – 12 percent of interceptions are returned for touchdowns while 87 percent of sacks don’t even result in a fumble – they happen a lot more frequently (defenses have averaged 2.45 sacks per game, but only 0.93 interceptions per game over the last two seasons).
The average sack rate was 0.070 over the last two seasons. Here are some quarterbacks to target for sacks in 2015.
| Quarterback | 2012-14 Sack Rate | 2012-14 Pass Attempts |
|---|---|---|
| Blake Bortles | 0.118 | 476 |
| Robert Griffin | 0.103 | 671 |
| Colin Kaepernick | 0.101 | 893 |
| Russell Wilson | 0.100 | 859 |
| Teddy Bridgewater | 0.097 | 402 |
| Ryan Tannehill | 0.088 | 1178 |
| Geno Smith | 0.088 | 810 |
| Cam Newton | 0.087 | 921 |
| Alex Smith | 0.086 | 973 |
| Josh McCown | 0.086 | 549 |
Blake Bortles and Geno Smith appear on both lists and are prime targets (if Smith even gets his job back after being the target of a sucker punch). A quarterback like Russell Wilson is not, however, because the Seahawks are rarely in negative game script, which as you’re about to see is crucial when assessing the viability of a defense/special teams selection.
Game Script
The more a team is in negative game script, the more it will pass, which benefits the opposing defense from a fantasy perspective (as you can see in Table 4 below).
| Leading | Tied | Trailing | |
|---|---|---|---|
| Sacks/ Play | 0.03 | 0.035 | 0.045 |
| Interceptions/ Play | 0.01 | 0.012 | 0.019 |
| Passing % | 49% | 56% | 66% |
The average NFL team passes two-thirds of the time while trailing – 35 percent more than they do while leading. More passing plays lead to more interceptions, as picks occur nearly twice as much when a team is trailing compared to when it is leading. Teams also give up 50 percent more sacks when trailing.
Vegas lines are sufficiently accurate to be used to project game script, and ultimately defensive production. Combining a game’s Vegas point spread and over/under gives you the amount of points Vegas projects each team to score. As you can see in Table 5 below, the less points Vegas projects a team to score, the more fantasy-friendly production you can expect for the opposing defense.
| Vegas Projected Points >= | Vegas Projected Points < | Points Scored/ Game | Interceptions Thrown/ Game | Sacks Allowed/ Game | Games |
|---|---|---|---|---|---|
| 0 | 17 | 16.1 | 1.340 | 2.94 | 41 |
| 17 | 20 | 18.7 | 0.989 | 2.69 | 179 |
| 20 | 23 | 21.6 | 0.976 | 2.61 | 297 |
| 23 | 26 | 24.0 | 0.875 | 2.43 | 272 |
| 26 | 29 | 27.6 | 0.859 | 1.96 | 170 |
| 29 | 30+ | 30.3 | 0.644 | 1.98 | 59 |
Vegas’ accuracy is remarkable and should be the backbone of your D/ST teams selection process. Ideally, you would like to target teams with low projected totals who are underdogs. Table 6 below shows the difference between favorites and underdogs in sacks and interceptions allowed over the last two seasons.
| Favorites | Underdogs | |
|---|---|---|
| Interceptions Thrown | 0.84 | 1.03 |
| Sacks Allowed | 2.29 | 2.62 |
Underdogs surrendered 23 percent more sacks per game and 14 percent more interceptions per game than favorites. Throughout the season, there will be many times when a bad team plays a worse team. The team with the advantage will likely have a depressed salary because they have mostly performed poorly up until that point, but they would offer value in that particular game in which they have the advantage. Season-long fantasy owners will be familiar with this concept, which is the backbone of “defensive streaming”. 4for4’s ‘Law of Averages’ report averages a team’s offensive stats with the stats allowed by the opposing defense, which along with Vegas lines can be used to highlight when a defense has the upper hand in a matchup.
Home/Road Splits
The home field advantage that exists in the NFL has an impact on defensive production. Defenses at home allow fewer points, sack the quarterback more and pick off more passes, as shown in Table 7 below.
| Defense at Home | Defense on Road | |
|---|---|---|
| Defensive TDs Allowed/ Game | 2.2 | 2.5 |
| Sacks/ Game | 2.58 | 2.31 |
| Interceptions/ Game | 0.95 | 0.91 |
| Fumble Recoveries/ Game | 1 | 1.11 |
| Opponent Completion % | 61.10% | 62.70% |
| Points Allowed/ Game | 21.6 | 24.4 |
Home field advantage will be accounted for in the Vegas lines, so you don’t have to avoid a road team with a favorable situation. However, your defense/special teams playing at home is the ideal scenario.
Consistency
D/ST scoring is very volatile from week to week. You might recall consistent fantasy performers are ideal for maximizing your floor in cash games, while volatile players help boost your ceiling in tournaments.
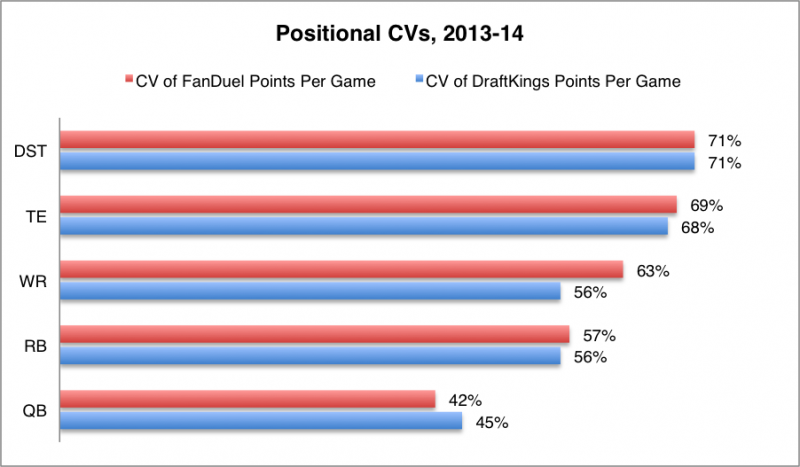
On average, defense/special teams score 71 percent more or 71 percent less than their actual seasonal mean fantasy points per game. That 71 percent figure is called the coefficient of variation (CV) – the standard deviation in weekly fantasy points divided by the mean of weekly fantasy points. At 71 percent, defense/special teams are the most volatile fantasy position, edging tight end at 69 percent (Fig. 1).
Figure 1
The inherent volatility, low-scoring nature and lack of differentiation between defense/special teams dictates investing the least amount of salary possible into the position in cash games. A bottom-up approach should be taken, where you start from the bottom of the defense/special teams salary list and aim to select the cheapest possible good value.
In tournaments it is more acceptable to pay a little more for a defense/special teams. I say “a little” because the position gets most of its value from its opposing matchup and projected game script, so there are usually cheap alternatives with good matchups on a weekly basis. Nevertheless, when choosing between multiple defense/special teams options at different price points, tournaments are the time to pay for more expensive options if they project for lower ownership.
It is also worth noting defense/special teams have higher ceilings than kickers (who tend to be similarly priced), which intuitively makes sense because they can score touchdowns while kickers cannot. Kickers tend to be more consistent and have higher floors, however, because they can’t score negative points.
Special Teams
Special teams doesn’t factor into defense/special teams scoring as much as team defense because the only way to score is on a touchdown. There were only 26 punt return touchdowns and 13 kickoff return touchdowns in the NFL over the last two seasons. While special teams aren’t a major factor in defense/special teams scoring, analyzing them can be useful when deciding between multiple options.
Punt return yardage per game, specifically, has a statistically significant 0.46 correlation3 to defense/special team fantasy points. Correlation does not imply causation, of course, but the moderate relationship does highlight the importance of game script and good field position to a D/ST’s fantasy success. The team with the defensive advantage in a given game will force more punts, giving a punt returner more chances at taking one to the house. Speaking of which, when seeking value in punt returns, target returners who don’t call for many fair catches. Certain teams value ball security over return yardage on punts, and their returners will often call fair catches.
Film study can also be helpful in analyzing special teams to assess return teams and coverage units. You want to target punt coverage units who allow a lot of returns (rather than fair catches) and those who miss a lot of tackles. On the flip side, look for return teams who seem to be “on the verge” of taking a punt to the house. These types of situations will not always be apparent, but can provide a useful edge when deciding between multiple similar options in a given week.
Summary
- Since touchdowns are valuable but unpredictable, look to maximize sacks and turnovers as they give you fantasy points and can also lead to touchdowns.
- Target opposing quarterbacks with low completion percentages and/or high sack rates.
- Positive game script is vital for defense/special teams – target Vegas favorites and teams whose opponents have low projected Vegas totals.
- Defense is a very volatile fantasy position – take a “bottom-up” approach in cash games, selecting the cheapest viable option.
- Defensive spending should be prioritized over kicker spending in tournaments because defense/special teams have higher ceilings than kickers.
Editors Note: Liked this article? You can check out the entire Daily Fantasy Playbook 2015 series here (Links will be updated as they become available): QB, RB, WR, TE, K, D/ST
Footnotes
1. A quick refresher on correlation coefficients: The scale is -1 to 1. Positive values indicate variables move in the same direction, while negative values indicate variables move in opposite directions. An absolute value of 1 means perfect correlation. Absolute values above 0.7 are considered strong, those between 0.3 and 0.7 are moderate, and those under 0.3 are weak.
2. http://thepowerrank.com/2014/01/31/how-to-predict-interceptions-in-the-nfl-backed-by-surprising-science/
3. Using data from 2013-14.


