The Definitive Guide to Stacking on DraftKings

Browse winning tournament lineups and you'll see at least one pair of teammates in almost every one. Stacking, or playing players in the same game whose production is correlated, is the backbone of successful GPP lineup construction.
This article will examine stacking on DraftKings from a data-driven standpoint. Specifically, it will answer the following questions:
- What are the correlations between each position?
- What are the odds of a stack "hitting"?
- What are the optimal stack combinations, both in terms of position and in terms of number of players stacked?
- Is there merit to stacking not only players on the same team, but also players on the opposing team, within a lineup?
- What is the relationship between the Vegas lines and stacking?
Methodology & Accurately Determining Positional Labels (WR1/WR2, etc.)
The dataset we will examine contains all NFL games from 2013–2017 For each game, DraftKings points scored for the following positions were tabulated for each team in the game:
- QB
- RB1, RB2
- WR1, WR2, WR3
- TE1
- DST
Perhaps the biggest challenge when answering questions like these is breaking the positions down into their specific roles. That is, it's obvious QB and WR is correlated, but what we really want to know is which WR we should be stacking? For instance, what are the odds of a QB-WR1 stack hitting compared to a QB-WR2, or a QB-WR1-WR2?
We could have simply determined WR1, WR2, and so on based on their finish in DraftKings points for their team over the full season, but that would have been backwards-looking and not very accurate. For example, even though Sterling Shepard finished the season as the Giants' leader in WR fantasy points, it would be wrong to have him labeled as the team's WR1 for Weeks 2–5 when Odell Beckham was healthy.
The solution? For each game, we labeled players at RB and WR based on where they ranked on their team in terms of projected points (using 4for4's projections) for that game. This allows us to not only capture dynamic role changes when players miss games or are promoted/demoted, but it's also predictive since projection information is available prior to each game. So going back to our previous example, Beckham would be labeled New York's WR1 for Weeks 2-5, but in the rest of their games, Shepard would be labeled the WR1.
DraftKings Stacking Correlation Matrix
Here is the DraftKings correlation matrix for each position that shows how correlated the positions are to each other:
DraftKings Correlation Matrix (2013–2017)
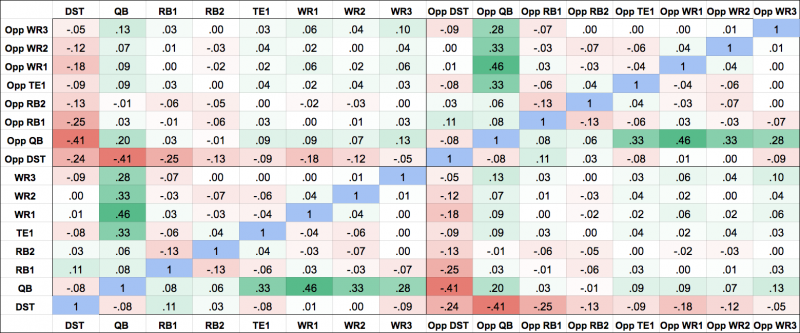
To make the chart bigger, right click, view image in a new tab, and zoom in.
Before we dive in and answer questions about optimal stacks, the odds of specific stacks hitting, and the like, here are some general highlights and takeaways from the correlation matrix:
- QB-WR1 is by far the strongest positively correlated stack. The correlation is .13 higher than the correlation between QB and his next highest receiver. Stacking a QB and his top receiver is the most common stack for good reason.
- QB-WR2 and QB-TE1 are tied for the second-strongest positively correlated stack. These correlations are only .05 higher than the next-strongest positively correlated QB-receiver stack (QB-WR3).
- QB-Opp DST is by far the strongest negatively correlated stack. This has implications as far as contrarian selections. If there will be a highly owned QB, you can potentially gain a big edge if that QB has a bad game and you've rostered the opposing DST, and vice-versa.
- Some positive correlation exists between QB and members of the opposing passing game, and especially between opposing QBs. DraftKings is a one-QB site, but this has implications as far as player exposure. If you are creating stacks for one QB in a given game, you should probably also have exposure to the opposing QB. This is also true to a lesser extent for WRs and TEs. If you're planning to have exposure to receivers on opposing teams, it can be advantageous to pair them up in the same lineup rather than having them in separate lineups.
- There is some correlation between RB1 and DST, but it is mild compared to QB-WR1, which is over four times as high, and QB-WR2/QB-TE1, which are three times as high. This suggests that we shouldn't necessarily be building lineups around RB-DST stacks the way we would QB-receiver, but instead try to pair a RB with his DST if you planned on having exposure to both anyway.
- There is a slight positive correlation between a QB and his RBs. The QB-RB stack shouldn't be avoided. In fact, we should probably be using it more often, as the subsequent data will show.
Going Beyond Correlation
The correlation matrix is a valuable tool for understanding the relationships between each position, but it doesn't tell the whole story when it comes to stacking. Remember, we want to know the odds of a particular stack hitting, and we want to know how Vegas lines affect each stack, among other things. Therefore, throughout the rest of this writing, we will look at stacks primarily through the lens of how many points they combined to score, rather than their value (points divided by salary). The reason I chose to look at it this way is that the amount of salary you spend on a stack will ultimately come down to what kind of value is available at other positions. In the end, you need 200-250 points or more to win a tournament -- you need all the players in your lineup to score a lot of points, regardless of salary.
Two-Man QB Stacks
I've put together a table showing the odds of two-man QB stacks combining to eclipse various DraftKings-point thresholds. Since an average of 25 DraftKings points per (non-DST) lineup slot would provide a 200-point floor, I set the floor at 50 for two-man QB stacks.
| 2-Man Stack | 50+ | 60+ | 70+ | 80+ |
|---|---|---|---|---|
| QB+WR1 | 15.3% | 6.6% | 2.1% | 0.7% |
| QB+RB1 | 7.5% | 2.0% | 0.2% | 0.1% |
| QB+WR2 | 7.2% | 1.7% | 0.5% | 0.1% |
| QB+TE1 | 5.6% | 2.1% | 0.6% | 0.2% |
| QB+WR3 | 3.1% | 1.0% | 0.3% | 0.1% |
| QB+RB2 | 2.1% | 0.5% | 0.0% | 0.0% |
| QB+DST | 1.8% | 0.2% | 0.0% | 0.0% |
The first thing you'll notice is the upside of the QB-WR1 stacks compared to the others. While some of the other stacks can score 50 or more at nearly half the rate of QB-WR1, no stack scores 60-plus, 70-plus, or 80-plus at even a third of the rate of QB-WR1.
The second big takeaway is that although QB-RB1 lacks some of the upside of the QB-receiver stacks, it is a viable stack (especially when Vegas odds are favorable, as you'll see after reading the Vegas Odds section of the article.)
I mentioned earlier that 25 points per slot is generally what all of your players (at least all of them except for DST) should be capable of scoring. So let's also look at stacking from a different vantage point. Since any QB you roster in a tournament should have at least 25-point upside, let's see what happens to the scoring at other positions when a QB actually scores 25 or more.
First, we'll look at the percentage of time each position scores 25 or more given a 25-plus-point game by the QB:
| Pos. | Avg | 25+ |
|---|---|---|
| Opp QB | 20.8 | 61.1% |
| WR1 | 23.1 | 44.0% |
| Opp WR1 | 17.1 | 26.2% |
| WR2 | 14.3 | 14.9% |
| TE1 | 12.8 | 13.8% |
| RB1 | 14.6 | 13.1% |
| Opp RB1 | 14.1 | 13.1% |
| Opp WR2 | 11.3 | 9.9% |
| Opp TE1 | 9.8 | 7.8% |
| WR3 | 9.7 | 6.7% |
| Opp WR3 | 8.0 | 5.0% |
| RB2 | 7.1 | 1.8% |
| Opp RB2 | 6.2 | 1.4% |
| DST | 6.6 | 0.7% |
| Opp DST | 4.0 | 0.4% |
In games where the QB scores 25 or more, WR1s are unsurprisingly the clear beneficiaries, averaging a stellar 23.1 points and scoring 25 or more 44.1 percent of the time, which are great odds that far surpass the odds of any other player you could stack a QB with.
Again, we see more evidence of the RB1 being a viable stacking partner with his QB, scoring 25 or more at nearly the same rate as the WR2 and TE1 when a QB eclipses the 25-point mark.
We also continue to see a strong correlation between a QB and members of the opposing passing game. When a QB posts a 25-point game, there's a 61-percent chance the opposing QB will too. And there's a 25-percent chance the opposing WR1 will do so as well. In fact, when a QB puts up a 25-point game, the opposing QB and WR1 are more likely to also put up a 25-point game than anyone on the QB's own team except his WR1.
We can also look at the viability of the various two-man QB stacks another way: what positions perform farthest above the norm when a QB scores 25 or more? The table below compares each position's average of DraftKings points when a QB scores to 25 to their overall average of DraftKings points in all games.
| Pos. | Avg in All | Avg in QB 25+ | % +/- |
|---|---|---|---|
| WR3 | 6.4 | 9.7 | 34.0% |
| WR1 | 15.3 | 23.1 | 33.8% |
| WR2 | 10.4 | 14.3 | 27.3% |
| TE1 | 9.5 | 12.8 | 25.8% |
| Opp WR3 | 6.4 | 8.0 | 20.0% |
| Opp QB | 18.1 | 20.8 | 13.0% |
| Opp WR1 | 15.3 | 17.1 | 10.5% |
| Opp WR2 | 10.4 | 11.3 | 8.0% |
| RB2 | 6.6 | 7.1 | 7.0% |
| RB1 | 13.7 | 14.6 | 6.2% |
| Opp TE1 | 9.2 | 9.8 | 6.1% |
| Opp RB1 | 13.7 | 14.1 | 2.8% |
| Opp RB2 | 6.6 | 6.2 | -6.5% |
| DST | 7.7 | 6.6 | -16.7% |
| Opp DST | 7.7 | 4.0 | -92.5% |
This sheds some more light on the order in the table before this one. RBs and members of the opposing passing game move down the list on this table, while a QB's receivers all move to the top. This table matches up with what most us of would suspect: that receivers have the most to gain when a QB has a big game.
QBs, WR1s, and RB1s are most likely to have 25-point games of all the positions, and those chances are further maximized when a QB scores 25. You want to be targeting those high scores, rather than just an increase in value over a player's norm, so looking only at the data above would ultimately prove limiting, and I'd still refer more to the chart before this one when making decisions. For instance, a WR3 that outperforms his normal production by 34.0 percent would still be irrelevant if he's still only scoring 8-10 points instead of 6-8 points. The main thing I would take from this data is that a QB having a big game has a positive effect on nearly every other player in the game, both on the QB's own team and on the opposing team.
Three-Man QB Stacks
Let's now turn our attention to three-man QB stacks. Here are the odds of the various pairings hitting (I set the floor for a successful stack to 75 DK points this time, or 25 per player):
| 3-Man Stack | 75+ | 90+ | 105+ |
|---|---|---|---|
| QB+WR1+RB1 | 7.8% | 1.9% | 0.4% |
| QB+WR1+WR2 | 6.3% | 2.0% | 0.1% |
| QB+WR1+TE1 | 5.7% | 0.6% | 0.3% |
| QB+WR1+WR3 | 3.9% | 0.5% | 0.2% |
| QB+WR1+RB2 | 3.6% | 0.2% | 0.0% |
| QB+WR2+RB1 | 3.3% | 0.4% | 0.1% |
| QB+TE1+RB1 | 2.4% | 0.5% | 0.1% |
| QB+WR2+TE1 | 2.0% | 0.3% | 0.1% |
| QB+WR3+RB1 | 1.6% | 0.1% | 0.1% |
| QB+WR2+WR3 | 1.5% | 0.1% | 0.0% |
| QB+TE1+RB2 | 1.5% | 0.0% | 0.0% |
| QB+WR3+TE1 | 1.3% | 0.3% | 0.1% |
| QB+RB1+RB2 | 1.0% | 0.1% | 0.1% |
| QB+WR2+RB2 | 0.8% | 0.1% | 0.0% |
| QB+WR3+RB2 | 0.6% | 0.1% | 0.1% |
The odds of any three-man QB stack hitting—averaging 25 points per player—top out at 7.8 percent, which is nearly half of the odds of a QB-WR1 stack hitting (15.3), but in line with some of the other two-man pairings. The takeaway is that three-man stacks can be viable, but you shouldn't overexpose yourself to them or risk diminishing returns.
We see the RB1 again making an appearance high up on the list. The RB1 is included in the optimal three-man stack in terms of scoring 75 or more, although the QB-WR1-WR2 stack slightly edges QB-RB1-WR1 in terms of scoring 90 or more.
The five top three-man stacks all include the WR1, so it doesn't look like a smart idea to fade the WR1 in a three-man stack (or a four-man stack, as you'll see in a few moments).
Here is how each positional pairing in a three-man QB stack fares when the QB scores 25 or more:
| Pos. Paired w/QB | Avg | % Both 25+ | % 50+ Combined |
|---|---|---|---|
| WR1+RB1 | 37.7 | 5.3% | 20.9% |
| WR1+WR2 | 37.4 | 6.0% | 19.1% |
| WR1+TE1 | 35.9 | 4.3% | 12.4% |
| WR1+WR3 | 32.8 | 3.2% | 12.1% |
| WR2+RB1 | 28.8 | 2.1% | 7.4% |
| WR1+RB2 | 30.3 | 0.7% | 6.7% |
| WR2+TE1 | 27.1 | 1.8% | 5.0% |
| WR3+TE1 | 22.5 | 1.4% | 3.9% |
| TE1+RB1 | 27.3 | 1.4% | 3.5% |
| WR2+WR3 | 23.8 | 0.4% | 2.8% |
| TE1+RB2 | 19.9 | 0.4% | 2.5% |
| WR3+RB1 | 24.2 | 0.0% | 1.8% |
| WR3+RB2 | 16.8 | 0.4% | 1.4% |
| RB1+RB2 | 21.7 | 0.4% | 1.4% |
| WR2+RB2 | 21.4 | 0.0% | 1.1% |
No major surprises here that we didn't already learn from the data in the previous table. The RB1 continues to emerge as a viable stacking partner with the QB.
It may be obvious to some, but I'll still point out that the table above serves as an excellent illustration of why we stack in the first place: While the chances of both players in each pairing scoring 25 or more each is low, the odds of both players scoring 50 or more combined is much higher—usually around three to four times as much.
Four-Man QB Stacks
Here are the odds for four-man QB stacks hitting (I set the floor for a successful stack to 100, or 25 per player):
| 4-Man Stack | 100+ | 120+ |
|---|---|---|
| QB+WR1+WR2+RB1 | 3.5% | 0.5% |
| QB+WR1+TE1+RB1 | 2.6% | 0.3% |
| QB+WR1+WR2+TE1 | 2.1% | 0.5% |
| QB+WR1+WR2+RB2 | 2.1% | 0.5% |
| QB+WR1+WR3+RB1 | 2.0% | 0.2% |
| QB+WR1+WR2+WR3 | 2.0% | 0.2% |
| QB+WR1+RB1+RB2 | 1.3% | 0.1% |
| QB+WR1+WR3+TE1 | 1.2% | 0.2% |
| QB+WR1+TE1+RB2 | 1.2% | 0.1% |
| QB+WR2+WR3+RB1 | 0.7% | 0.0% |
| QB+WR2+WR3+TE1 | 0.7% | 0.1% |
| QB+WR1+WR3+RB2 | 0.7% | 0.3% |
| QB+WR3+TE1+RB2 | 0.6% | 0.1% |
| QB+WR2+RB1+RB2 | 0.6% | 0.0% |
| QB+WR3+TE1+RB1 | 0.5% | 0.1% |
| QB+TE1+RB1+RB2 | 0.5% | 0.0% |
| QB+WR2+WR3+RB2 | 0.2% | 0.0% |
| QB+WR3+RB1+RB2 | 0.2% | 0.1% |
The odds for the highest four-man stack to average 25 points per slot (3.5 percent) are considerably lower than the highest two-man (15.3) and three-man (7.8) stacks to do so. All the four-man QB stacks that have at least a 1.0-percent chance of scoring 100-plus contain the WR1, and two-thirds contain an RB.
| Pos. Trio Paired w/QB | Avg | % All 25 | % 75+ Combined |
|---|---|---|---|
| WR1+WR2+RB1 | 52.0 | 0.7% | 9.6% |
| WR1+TE1+RB1 | 50.8 | 0.4% | 6.0% |
| WR1+WR3+RB1 | 47.4 | 0.0% | 4.3% |
| WR1+WR2+TE1 | 50.2 | 1.1% | 3.5% |
| WR1+WR2+WR3 | 47.1 | 0.4% | 3.2% |
| WR1+RB1+RB2 | 44.8 | 0.0% | 2.5% |
| WR1+WR2+RB2 | 44.6 | 0.0% | 2.1% |
| WR1+WR3+TE1 | 45.6 | 0.4% | 1.8% |
| WR1+TE1+RB2 | 43.0 | 0.0% | 1.8% |
| WR1+WR3+RB2 | 40.0 | 0.4% | 1.4% |
| WR2+WR3+RB1 | 38.5 | 0.0% | 1.1% |
| WR3+TE1+RB1 | 37.0 | 0.0% | 1.1% |
| WR3+TE1+RB2 | 29.6 | 0.0% | 1.0% |
| WR2+WR3+TE1 | 36.7 | 0.4% | 0.7% |
| WR2+WR3+RB2 | 31.1 | 0.0% | 0.7% |
| WR2+RB1+RB2 | 36.0 | 0.0% | 0.7% |
| WR3+RB1+RB2 | 31.4 | 0.0% | 0.4% |
| TE1+RB1+RB2 | 34.5 | 0.0% | 0.4% |
Once again we see the benefits of stacking in that the odds are low that all three players paired with a QB in a four-man stack when he scores 25-plus will all also score 25-plus each; meanwhile, the odds of all four players scoring 100 combined are much higher.
The RB1 is in the top three four-man QB stacks when the QB scores 25 or more. In 2017, 37 percent of offensive touchdowns in the NFL were scored by running backs, so when an offense erupts for a high number of points, including the RB1 in your stack would give you a good shot at having exposure to every single one of that offense's touchdowns.
Running Back-Defense Stacks
The logic for the RB-DST stack makes sense: if a team's defense is successful, that means they'll be ahead and the RB will see clock-killing duties. However, since DraftKings's full-PPR scoring favors pass-catching RBs, and since a defense could do well in real life without necessarily piling up a ton of sacks or turnovers needed for a high amount of DraftKings points, the correlation between RB and DST is relatively mild. Here is the data (I set the floor for a successful RB-DST stack at 40 rather than 50, since DSTs score less than other positions):
| 40+ | 45+ | 50+ | 55+ | |
|---|---|---|---|---|
| RB1+DST | 6.5% | 4.4% | 1.4% | 0.8% |
| RB2+DST | 0.9% | 0.3% | 0.3% | 0.1% |
An RB1-DST stack will only hit 40 points 6.5 percent of the time, and the chances of the stack eclipsing 50 are minimal. The RB2 shouldn't be an option.
Over the last five seasons, DSTs scored 15 or more DraftKings points 12.8 percent of the time, or 3.86 times per week, so scoring 15-plus essentially equates to having a top 3-4 DST in a given week. How did RBs perform when a DST scored 15 or more?
| Avg | 25+ | |
|---|---|---|
| RB1 | 15.0 | 14.9% |
| RB2 | 7.6 | 1.4% |
When a DST scores 15 or more, the RB1 does get a slight bump, scoring 25-plus at a 14.9-percent clip compared to their 11.5-percent rate in all games. The RB-DST stack is a solid option when you can make it happen, but as I mentioned earlier, it doesn't make a ton of sense to base your lineup around it.
Vegas Odds
Let's finish up by looking at what kind of Vegas odds are present for each stack. I looked at the Vegas odds for each "successful" two-, three-, and four-man stack types with a minimum of 20 occurrences over the last three seasons.
I defined a successful stack as:
- Two-man QB stacks that score 50-plus
- Three-man QB stacks that score 75-plus
- Four-man QB stacks that score 100-plus
- RB-DST stacks that score 40-plus
As you go through the data, keep in mind that from 2013 to 2017, 35.7 percent of implied team totals were 24 or higher, and 12.4 percent of implied team totals were 27 or higher.
| 2-Man Stack 50+ | Amount | Avg Team Total | Avg O/U | Avg Spread | Fav % | Tm Total 24+ | Tm Total 27+ |
|---|---|---|---|---|---|---|---|
| QB+WR1 | 235 | 24.1 | 46.5 | -1.7 | 63.1% | 52.5% | 20.8% |
| QB+RB1 | 115 | 25.3 | 47.7 | -3.0 | 72.2% | 64.3% | 33.0% |
| QB+WR2 | 110 | 24.4 | 47.3 | -1.5 | 53.6% | 50.9% | 27.3% |
| QB+TE1 | 86 | 24.7 | 47.0 | -2.4 | 64.0% | 57.0% | 31.4% |
| QB+WR3 | 47 | 24.7 | 47.1 | -2.3 | 63.8% | 53.2% | 29.8% |
- QB-RB1 stacks have the highest average team total (25.3). As I mentioned previously, the QB-RB1 stack is a reflection of success of the entire offense, so it makes sense that the team total is higher for a successful QB-RB1 stack than for any of the QB-receiver stacks. QB-RB1 stacks also have a larger average spread (-3.0) and favorite percentage (72.2) than any of the QB-receiver stacks. A lot of that is due to higher team totals and vice-versa, but it also indicates the "pass to get a lead, run to hold the lead" game script is playing out more often than not when the QB-RB1 stack is successful.
- QB-WR1 is the most effective stack, so it's no surprise it required the lowest team total (24.1) and over/under (46.5), on average.
- It looks like the players that tend to score touchdowns from shorter distances require higher spreads to pay off in stacks: the RB1, TE1, and WR3 (which is the slot receiver most of the time) stacks all had an average spread of 2.3 or higher, while the WR1 and WR2 stacks both had average spreads of 1.7 or lower.
| 3-Man Stack 75+ | Amount | Avg Team Total | Avg O/U | Avg Spread | Fav % | Tm Total 24+ | Tm Total 27+ |
|---|---|---|---|---|---|---|---|
| QB+WR1+RB1 | 120 | 25.0 | 47.2 | -2.8 | 72.5% | 62.5% | 29.2% |
| QB+WR1+WR2 | 97 | 24.9 | 47.2 | -2.5 | 64.9% | 57.7% | 25.8% |
| QB+WR1+TE1 | 87 | 24.7 | 47.3 | -2.1 | 66.7% | 57.5% | 28.7% |
| QB+WR1+WR3 | 60 | 25.0 | 47.1 | -3.0 | 73.3% | 55.0% | 31.7% |
| QB+WR2+RB1 | 51 | 25.7 | 48.3 | -3.1 | 68.6% | 70.6% | 33.3% |
| QB+TE1+RB1 | 38 | 25.3 | 48.2 | -2.5 | 60.5% | 55.3% | 34.2% |
| QB+WR2+TE1 | 31 | 26.0 | 48.2 | -3.7 | 61.3% | 61.3% | 45.2% |
| QB+WR3+RB1 | 24 | 25.4 | 47.5 | -3.3 | 70.8% | 66.7% | 33.3% |
| QB+WR2+WR3 | 23 | 25.7 | 48.1 | -3.3 | 60.9% | 56.5% | 43.5% |
| QB+WR3+TE1 | 20 | 25.9 | 48.4 | -3.3 | 75.0% | 65.0% | 45.0% |
- The minimums and maximums in each category for the three-man stacks are higher than for the two-man stacks, which indicates that you need more favorable Vegas odds for three-man stacks to hit than for two-man stacks to hit:
- Average Team Total: 24.1-25.3 (two-man) vs. 24.7-26.0 (three-man)
- Average Over/Under: 46.5-47.7 (two-man) vs. 47.1-48.4 (three-man)
- Average Spread: -3.0-[-1.5] (two-man) vs. -3.7-[-2.1] (three-man)
- Favorite Percentage: 53.6%-72.2% (two-man) vs. 60.5%-75.0% (three-man)
- Team Total of 24-Plus: 50.9%-64.3% (two-man) vs. 55.0%-66.7% (three-man)
- Team Total of 27-Plus: 21.8%-33.0% (two-man) vs. 25.8%-45.2% (three-man)
| 4-Man Stack 100+ | Amount | Avg Team Total | Avg O/U | Avg Spread | Fav % | Tm Total 24+ | Tm Total 27+ |
|---|---|---|---|---|---|---|---|
| QB+WR1+WR2+RB1 | 54 | 25.4 | 47.9 | -3.0 | 72.2% | 66.7% | 31.5% |
| QB+WR1+TE1+RB1 | 40 | 25.4 | 47.4 | -3.4 | 75.0% | 65.0% | 37.5% |
| QB+WR1+WR2+TE1 | 33 | 24.3 | 47.4 | -1.3 | 48.5% | 48.5% | 24.2% |
| QB+WR1+WR3+RB1 | 31 | 25.1 | 47.8 | -2.4 | 74.2% | 67.7% | 35.5% |
| QB+WR1+WR2+WR3 | 30 | 25.0 | 47.7 | -2.2 | 63.3% | 56.7% | 30.0% |
| QB+WR1+WR3+TE1 | 20 | 25.4 | 47.9 | -2.9 | 75.0% | 60.0% | 30.0% |
- There is not as much of a difference between the minimum and maximums in each category of three- and four-man stacks as there was between two- and three-man stacks. The biggest difference is that four of six four-man stacks were favorites at least 70 percent of the time, while only four of 10 three-man stacks were favorites at least 70 percent of the time. If you're going to deploy a four-man stack, your best bet is to stick with favorites only.
| RB+DST Stack 40+ | Amount | Avg Team Total | Avg Opp Tm Total | Avg O/U | Avg Spread | Fav % | Tm Total 24+ | Tm Total 27+ | Opp Team Total < 24 | Opp Team Total <20 | Spread -3+ | Spread -6+ |
|---|---|---|---|---|---|---|---|---|---|---|---|---|
| RB1+DST | 100 | 24.6 | 21.5 | 46.1 | -3.1 | 69.0% | 60.0% | 25.0% | 72.0% | 29.0% | 58.0% | 31.0% |
- Over 70 percent of successful RB-DST stacks had an opposing team total of under 24, and nearly 60 percent were favorites by three points or more.
- Compared to the QB-receiver stacks, RB-DST stacks are more likely to be favorites and more likely to have a team total above 24. In other words, you need more favorable Vegas odds for a RB-DST stack to pay off than for a two-man QB-receiver stack.
- The average spread (-3.1) for a successful RB-DST stack was higher than any of the two-man QB stacks, narrowly edging QB-RB1 (-3.0).
Recapping Stacking on DraftKings
- QB-WR1 is far and away the stack with the best odds of hitting.
- Although the correlations are higher for the WR2/WR3/TE1, the RB1 tends to be the second-best position to pair with a QB because this potentially exposes you to all of an offense's touchdowns in a given game.
- There is a relatively strong correlation between opposing passing games.
- RB-DST stacks are not nearly as effective as two-man QB stacks.
- The top three- and four-man stacks always contain the WR1.
- Stacks of all types are more likely to hit when a team is a favorite with a team total of at least 24.
- Three-man stacks, four-man stacks, and RB-DST stacks should only be used with extremely favorable Vegas odds.
Photo by Dylan Buell/Getty Images.


